
October’s employment report challenges a simple decline narrative. It does not justify replacing it with a simple recovery story.
U.S. payrolls increased by 165,000 in October. August and September were revised upward by a combined 84,000 jobs. Those figures deserve attention if the market conversation you encounter is dominated by layoffs and downsizing. They also deserve the same scrutiny we should apply to a negative headline. Source: BLS employment report.
The useful conclusion is not that layoffs are imaginary or that every employer is expanding. The headline tells us what happened. Context helps us understand what it means, whose conditions it describes, and whether it should change a decision. We need both, especially when apparently conflicting stories compete for our attention.
The decision principle: The calm comes from a repeatable process, not a comfortable narrative. Bring content and context together before changing an exposure limit.
What the October evidence actually supports
The BLS report, released November 6, shows stronger payroll growth than the average monthly gain of 48,000 over the preceding 12 months. August’s gain was revised from 133,000 to 186,000. September’s moved from 29,000 to 60,000. The revisions strengthen the recent picture, but they belong to those earlier months, not to October’s 165,000 gain. Source: BLS.
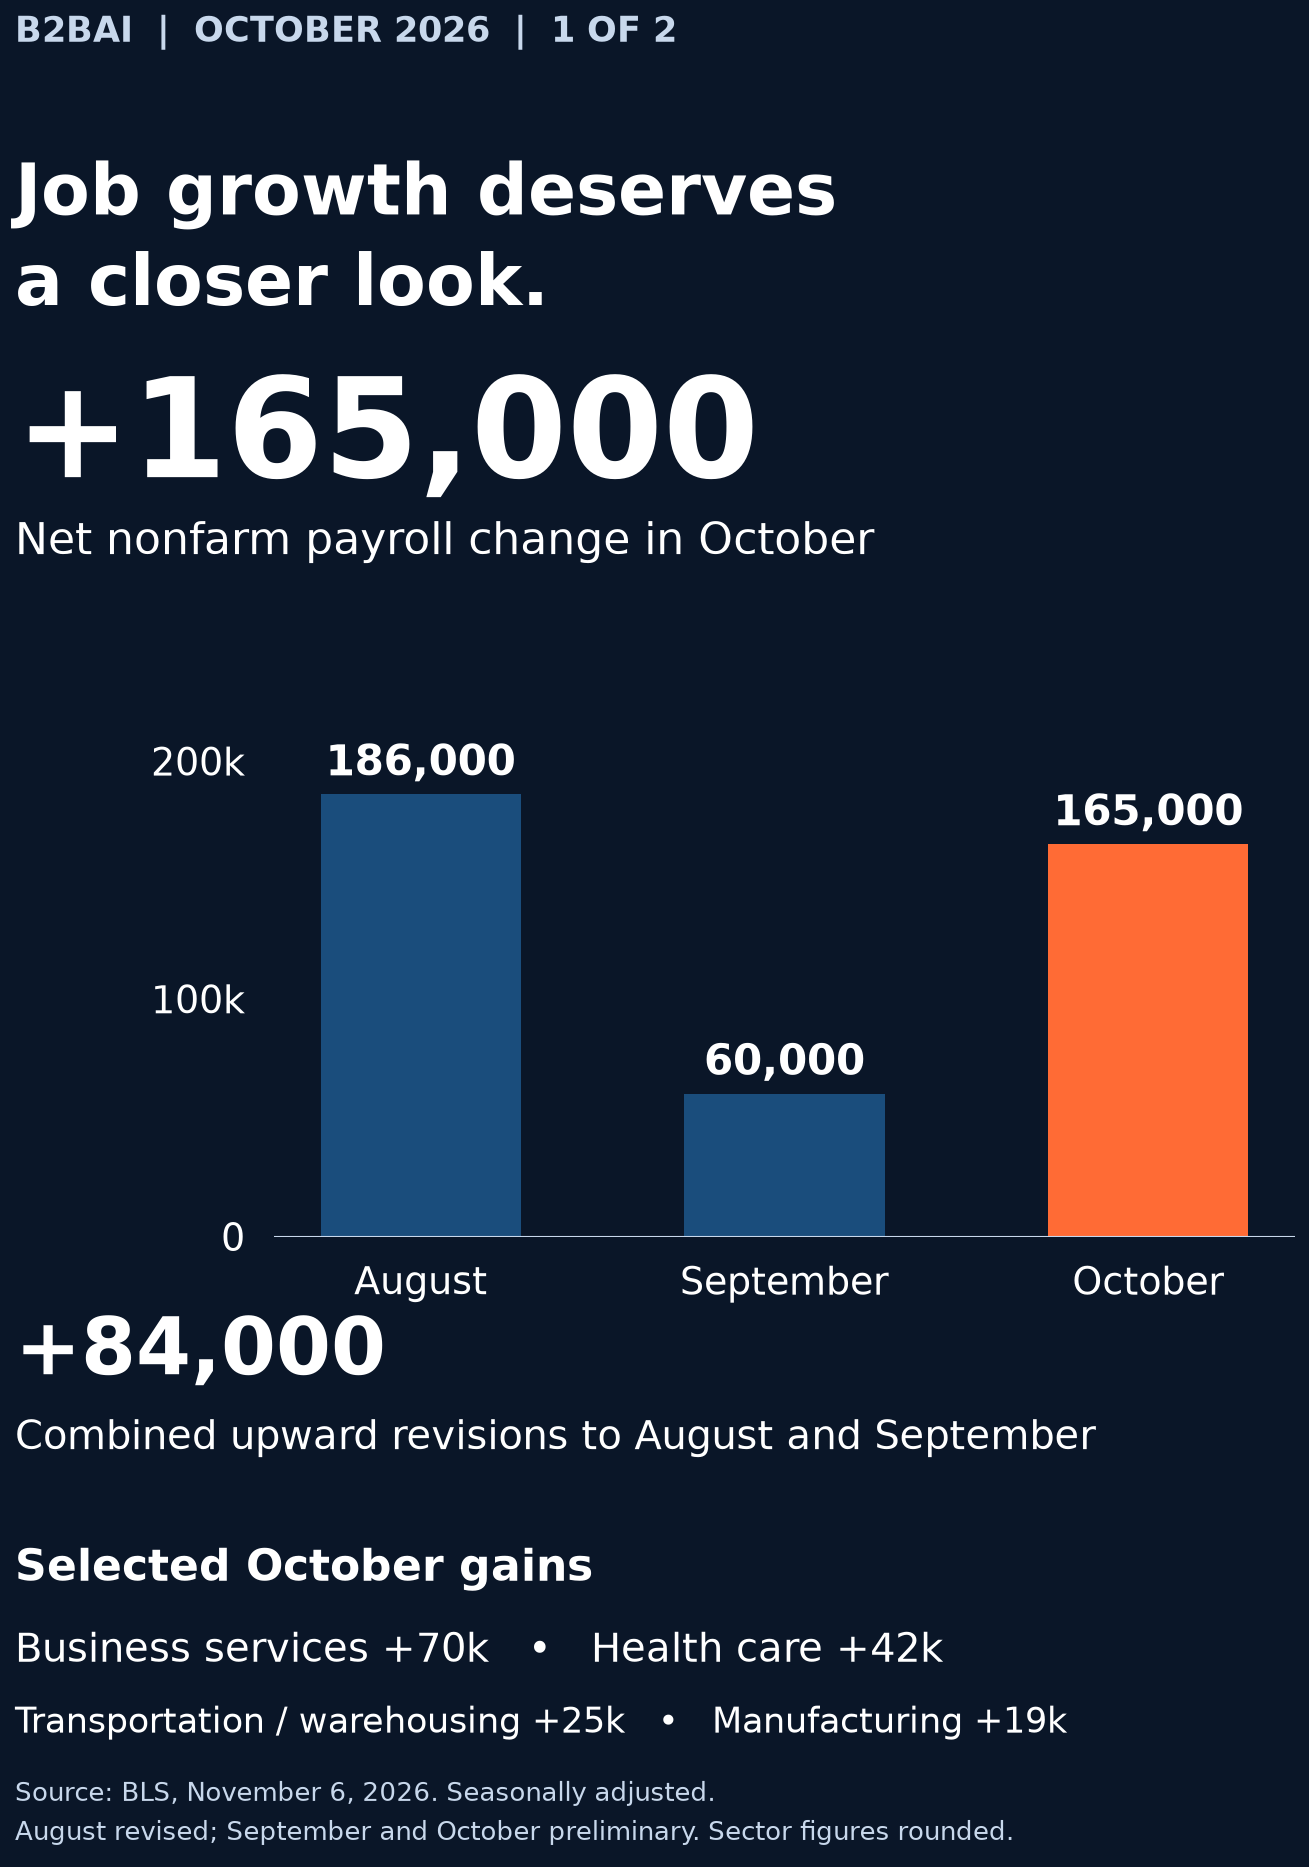
Hiring was not confined to health care. Professional and business services added 70,000 jobs, health care added 42,000, transportation and warehousing added approximately 25,000, and manufacturing added 19,000. That breadth matters, although it does not establish that every sector or location is improving. Source: BLS.
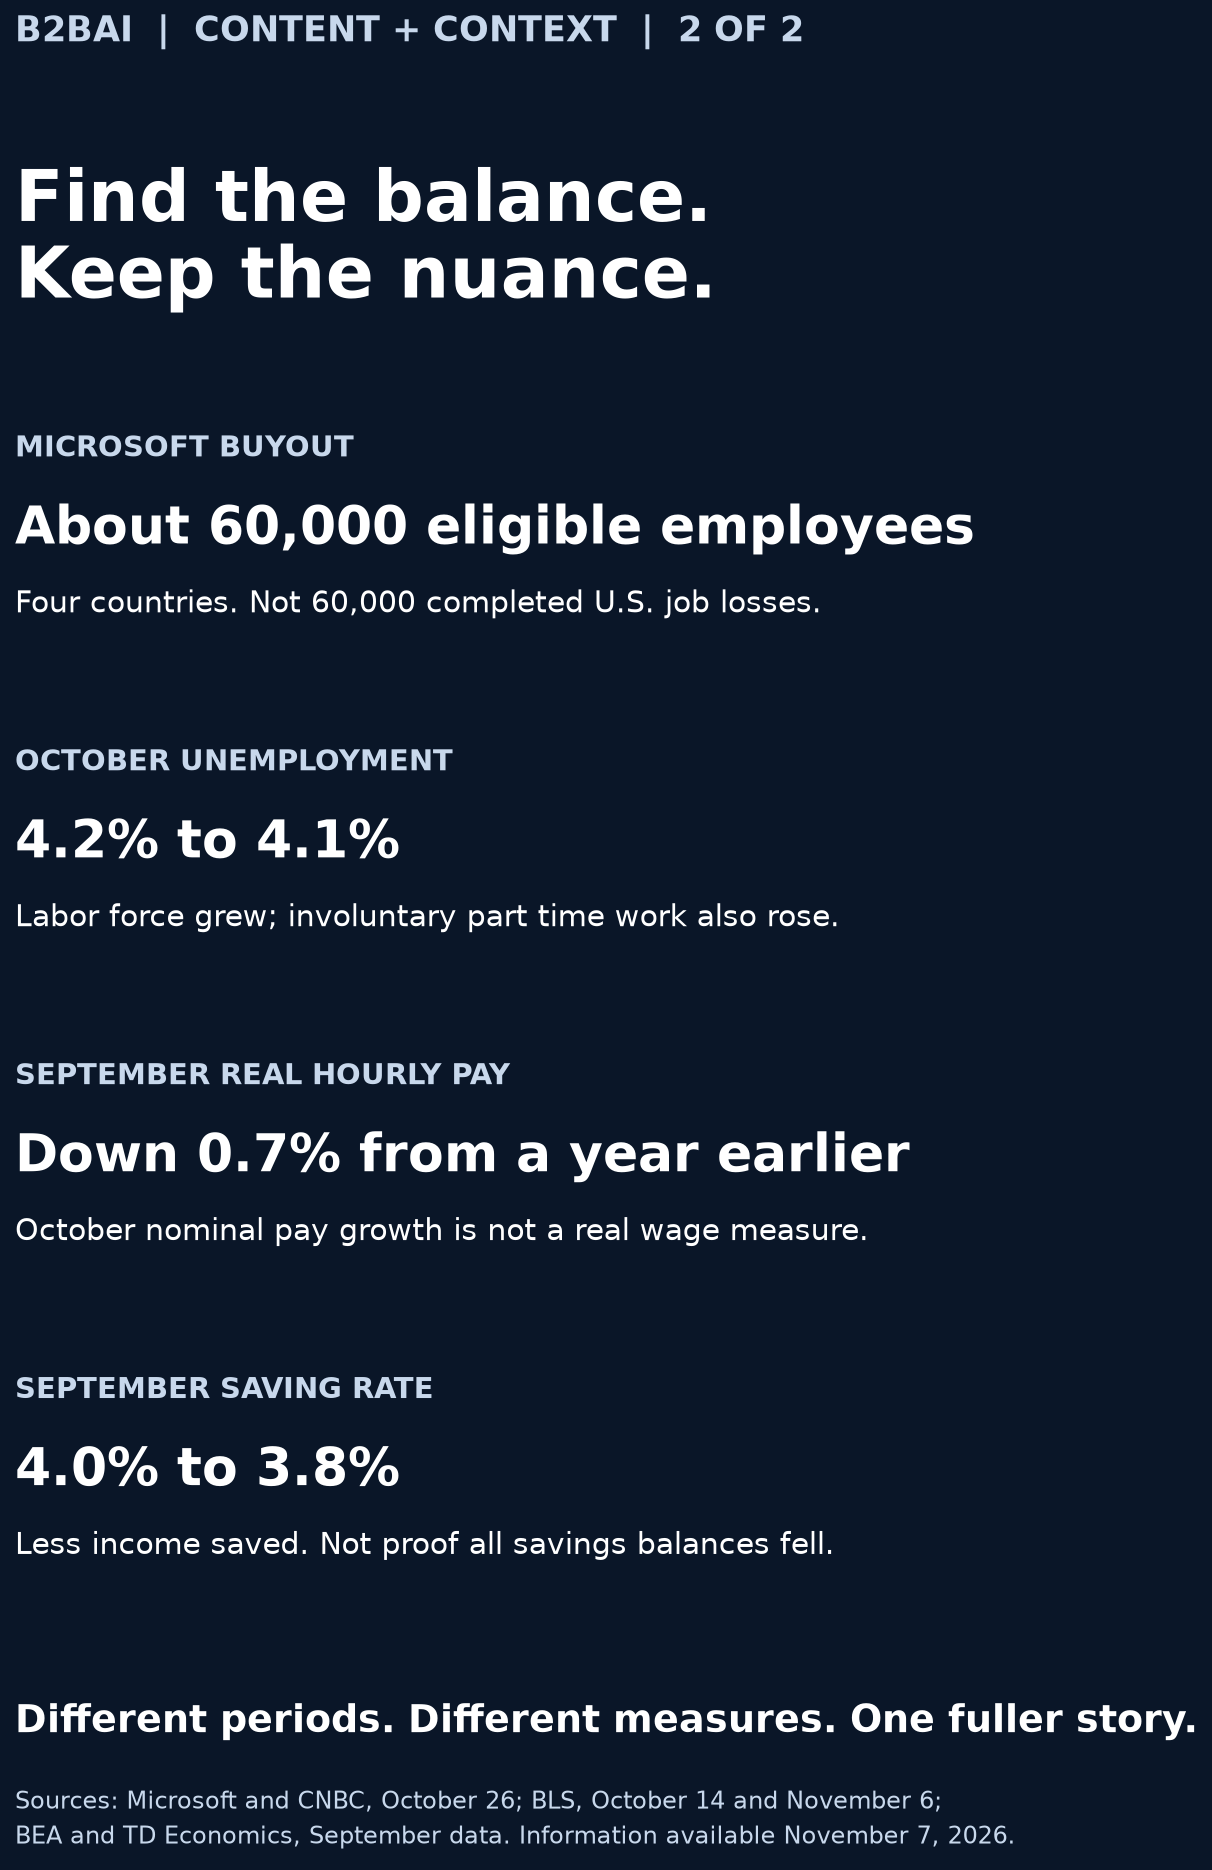
The unemployment rate moved from 4.2% to 4.1%, while the labor force expanded by 421,000 and participation edged from 61.8% to 61.9%. Average hourly earnings rose 0.4% during the month and 3.1% compared with the same month last year. BLS describes the unemployment and participation changes as little changed, a useful restraint against turning small movements into sweeping claims. Source: BLS.
The layoff story is real, but incomplete
Reuters reported on October 28 that Amazon cut about 250 jobs in its devices and services unit, following approximately 1,000 cuts in its retail division earlier that month. These are specific company events, not evidence to dismiss because the national total improved. For the people affected, the consequences are immediate. Source: Reuters company report.
Microsoft adds an important example of workforce changes unfolding in stages. Its July communication announced around 4,800 role eliminations and described participation in an earlier voluntary retirement program. Its October 26 communication introduced a separate voluntary exit offer. CNBC and Reuters reported that approximately 60,000 employees were eligible across Canada, India, the United Kingdom, and the United States. Source: Microsoft’s July communication; October communication; CNBC.
That headline describes eligibility, not 60,000 accepted offers or completed job losses. It also describes a global program, not a U.S. employment count. CNBC reported a decision deadline in early December and departures on December 31 for participants. Those were future dates as of this article. Challenger excluded the offer pool from its October cut total because it records voluntary programs through accepted offers or a stated reduction target. This is a timing and measurement distinction, not a reason to minimize the uncertainty employees face. Source: CNBC; Challenger methodology.
Block adds the repeated layoff cycle. Fast Company reports another round after the company announced more than 4,000 cuts in February. Business Insider reviewed an employee email identifying changes in Customer Ops, Risk Ops, and Learning & Content Operations. The latest affected headcount had not been disclosed. For employees, another round can prolong uncertainty even when national hiring improves. Source: Fast Company; Business Insider.
The explanation needs equal care. Dorsey linked February’s reductions to AI and other intelligence tools. Business Insider reports that the latest email did not mention AI explicitly, although it discussed better tools for routine tasks and more attention to complex cases. We should not turn that into a verified claim that AI caused every role elimination. Nor should a second round automatically be read as proof of declining customer demand. Those are hypotheses requiring evidence, not interchangeable explanations. Source: Business Insider’s reporting on the email.
There is a timing distinction too. Block’s new round was reported in November; it is not a direct contradiction of October payroll growth. An announcement may describe future departures, a company may cut some functions while hiring elsewhere, and national gains can coexist with concentrated losses. The consequence for a risk team is to investigate the operating impact on its own exposure, rather than declare either the company headline or the aggregate number the winner.
The broader announcement data tells a different story from an accelerating nationwide wave of cuts. Challenger recorded 43,994 announced U.S. job cuts in October, up 2% from September but down 71% from the same month last year. Its report also identifies concentrated pressure, including technology, rather than uniform improvement everywhere. Source: Challenger.
That does not prove that negative reporting dominates the entire market conversation. Establishing media prevalence would require a defined set of outlets, dates, articles, and a classification method. What the evidence does support is narrower and more useful: selected company cuts should not be treated as a complete description of national employment conditions.
Do not replace a negative narrative with selective optimism
A falling unemployment rate can raise a fair question: are people finding work, or are they leaving the search? In October, the labor force increased by 421,000, participation edged up, and the household survey’s employed population increased by 463,000. Those aggregate movements do not support describing this improvement simply as people giving up. They do not reveal every individual transition either. Source: BLS household survey.
People who stop actively looking can fall outside the official unemployment count. BLS separately measures discouraged workers, whose estimate rose from 414,000 to 448,000, although the agency described the monthly change as little changed. We should monitor that signal without allowing it to erase the simultaneous growth in labor force participation and employment. Source: BLS definitions and table A.
The report contains genuine warning signals. People working part time for economic reasons increased by 339,000 to approximately 4.8 million. BLS describes these workers as wanting full time employment but having reduced hours or being unable to find full time jobs. Reuters reports that broader labor underutilization rose from 7.6% to 7.9%. Source: BLS; Reuters employment analysis.
Long job searches remain another concern. CNBC reports that the number unemployed for more than 27 weeks reached approximately 1.96 million, the highest since December 2021. BLS calls the monthly change little changed. The level is troubling without overstating the size of the latest movement. Source: CNBC; BLS.
Employment status is not the same as employment adequacy. Someone working reduced hours can be employed while still unable to earn what the household needs. The rise in involuntary part time work is evidence of hours pressure, not proof that everyone is accepting a lower skill role. We should measure the distinction rather than supply a story the data does not establish.
Wage growth is a story. Purchasing power is the context.
October’s 3.1% annual increase in average hourly earnings is nominal. It tells us what happened to pay before accounting for prices. As of November 7, October’s CPI and real earnings releases were still scheduled for November 10. Subtracting September inflation from October wage growth would mix periods and would not establish October’s real wage change. Source: October employment report; BLS real earnings release and schedule.
The latest matched real earnings report, for September, already shows the household tension. Nominal hourly earnings rose 0.1% during the month, but consumer prices rose 0.6%. BLS reported real hourly earnings down 0.5% for the month and down 0.7% from a year earlier. A pay increase and a loss of purchasing power can both be true. These are averages, not every worker’s experience. Source: BLS September real earnings.
Spending can hold up while financial breathing room narrows
September’s BEA data provides another paired story. Consumer spending increased 0.5% in current dollars, while disposable personal income increased 0.2%. After inflation, disposable income declined 0.3% and spending was essentially flat. TD Economics reports that the personal saving rate fell from a revised 4.0% in August to 3.8% in September. Spending resilience and household pressure need not contradict one another. Source: BEA; TD Economics.
The saving rate measures the share of disposable income being saved, not the balance already held in savings accounts. A lower positive rate means households collectively saved a smaller share of current income. It does not, by itself, prove that existing savings balances declined or that every consumer funded purchases by drawing them down. Some households may face that reality, but this aggregate release cannot identify which ones.
For commercial decisions, that distinction matters. If your customers serve financially stretched consumers, examine order mix, payment timing, cancellations, and requests for extended terms. Do not infer a specific customer’s resilience from total spending, or infer its distress solely from a lower national saving rate. Connect the market context to the cash flow actually moving through your portfolio.
Forecast comparisons need definitions too. CNBC cited a Dow Jones payroll forecast of 59,000; Reuters cited its own poll at 65,000. October exceeded both, but there was no single universal forecast. Similarly, the reported rise in expectations for a December rate increase was a market reaction, not a Federal Reserve commitment. Neither belongs at the center of an operating decision without further analysis. Source: CNBC; Reuters.
Three measures that should not be blended
| Measure | What it captures | Decision mistake to avoid |
|---|---|---|
| Nonfarm payroll change | Net change in payroll jobs measured by the establishment survey. | Reading net growth as gross hiring, or subtracting announced cuts again. |
| Unemployment and participation | People’s labor force status measured by the household survey. | Adding the household employment change to payroll growth. |
| Announced job cuts | Employer announcements tracked by Challenger. | Treating announced plans as the same period’s completed job losses. |
BLS explains that its two surveys have different scopes and counting rules. The payroll survey counts jobs, including separate payroll appearances for someone holding multiple jobs. The household survey counts people once. Challenger’s report concerns announcements and applies its own treatment to voluntary exit programs. The numbers can illuminate one another without being interchangeable. Source: BLS methodology; Challenger reporting notes.
A Decision Intelligence Framework for the next exposure decision
1. Define what changed
Before changing a plan, identify the measurement, release date, comparison period, and revision status. Ask whether the evidence describes an announcement, an observed result, or an expectation. This is how data driven decisions begin: with a question the evidence can actually answer.
2. Identify whose conditions matter
A national gain does not identify the risk of your next customer or vendor. Segment the evidence by the industries, locations, and business relationships that matter to your portfolio. For Procurement, focus on the counterparties whose financial strain would interrupt a critical commitment.
3. Connect external signals to internal behavior
Compare the relevant market evidence with your own payment patterns, order activity, disputed invoices, staffing needs, and customer conversations. An improving national number should not override deteriorating account behavior. A company layoff announcement should not automatically override stable payments and a sound operating position either.
4. Set an action threshold before the next headline
Specify what combination of evidence would justify changing a credit limit, accelerating collections review, or reducing a Procurement commitment. Keep the response proportional to the exposure. A targeted review may be appropriate where a blanket restriction would unnecessarily constrain healthy business.
This is the financial payoff. Indiscriminate tightening can restrict healthy customers and delay productive activity. Indiscriminate expansion can increase exposure to weakening ones. Strategic insights earn their value when they improve how working capital is allocated, not when they make a dashboard feel more reassuring.
Look behind both headlines
October’s evidence challenges the assumption that visible layoffs describe the whole economy. It also challenges the assumption that positive payroll growth describes every worker’s experience. The unemployment rate can improve while hours remain insufficient. Pay can increase while purchasing power weakens. Spending can continue while room to save narrows.
Balance does not mean giving every claim equal weight or finding a midpoint between optimism and fear. It means testing each claim, preserving the distinctions that matter, and accepting what remains uncertain. Content without context encourages overreaction. Context without evidence can become another comforting story.
Transform the market signal into a defined question, connect it to your own exposure, and decide what evidence would change your action. The calm is not certainty about the next headline. It is confidence in a process that protects cash flow while preserving healthy business. That is how Strategic insights become a fuller story and a better decision.
Internal Knowledge + External Insights = Competitive Intelligence. That is your Decision Intelligence Framework.
Sources and editorial scope
BLS: The Employment Situation, October 2026. Primary source for payrolls, revisions, unemployment, participation, earnings, and survey definitions.
Challenger: October job cut and hiring announcements. Announcement figures are not combined with payroll estimates.
CNBC: October jobs report and Reuters: October employment analysis. Independent reporting on forecasts, labor underutilization, prolonged unemployment, and market reaction.
Reuters: Amazon devices unit job cuts. The company headline is quoted with attribution, not reproduced as a publisher screenshot.
Figures reflect the releases available November 7, 2026 and remain subject to revision where indicated. Charts use BLS monthly payroll changes and Challenger announcement totals as separate measures. The decision framework is analysis and recommendation, not a claim of observed company outcomes. No claim of media bias or measured headline prevalence is made.
Additional context sources
Microsoft: October voluntary exit offer and July workforce changes. Company statements establish the program sequence; CNBC’s reporting supplies the approximate eligibility pool and future timing.
Fast Company: Block’s repeated job cuts and Business Insider: reporting on the employee email. The latest headcount and a definitive cause are not asserted.
BLS: September real earnings. Uses matched earnings and price periods, rather than combining September inflation with October wages.
BEA: September personal income and outlays and TD Economics analysis. Savings flow is distinguished from accumulated household balances.